Today, I’d like to show you how to implement a serverless ETL pipeline, which loads data from CSV files into a BigQuery dataset and runs K-means clustering on loaded data. I’m going to guide you through the entire process, datas, the tools and show you code examples. Let’s dive in!
What You’ll Need:
We are going to use the following:
- BigQuery. A serverless data warehouse provided by Google Cloud Platform, which is able to scale from megabytes to petabytes of data without any effort. When you’re using BigQuery, you only pay for processed data (1st TB is free) not for the time of query execution. What’s more, BigQuery is a column database so you can select only a few columns in your query and you will be charged only for processing the data stored in the selected columns.
- DataFlow. It’s a stream and batch processing serverless solution based on Apache Beam, which allow you to define ETL pipeline. DataFlow is able to scale up from 1 to several hundreds of VM workers just in just a few seconds.
- K-means. An unsupervised machine learning algorithm, which allow you to categorize your data. As a result, you will get neat sets of points grouped around centroids.
- Kotlin. One of the JVM’s languages, which is fully compatible with Java. By using Kotlin we are be able to write shorter and more functional code.
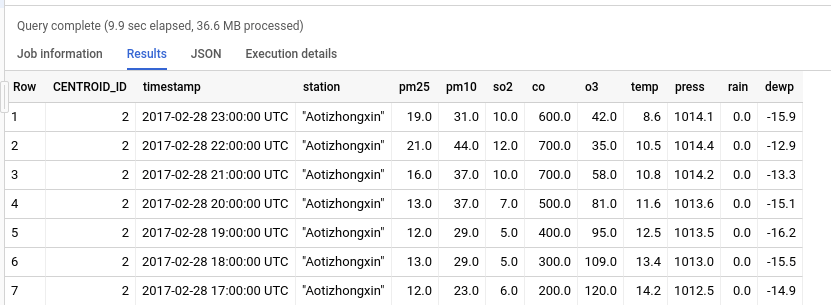
As well as the technologies above, we will also be using the Beijing Multi-Site Air-Quality Data Data Set, which contains hourly air-quality measurements taken from March 1st, 2013 to February 28th, 2017. Data from each meter is stored as a CSV data file. Let’s check out an example file to get familiar with how it works. Here’s the Head of the PRSA_Data_Aotizhongxin_20130301–20170228.csv file:

Our goals:
We’re going to find all the CSV files which match the filename pattern, remove CSV headers, read records from the CVS file, save those records into BigQuery, train the K-means model and cluster the BigQuery table with meter measurements.
The entire code is available in my GitHub repository.
What You Need To Do
Let’s create ETL DataFlow Pipeline. First, we have to create an object that will be used to define the DataFlow Pipeline. You have to specify the following:
- GCP project’s name,
- Staging and temp location,
- DataFlow job’s name,
- And the Runner.
DataFlow is based on Apache Beam, so the code can be run on many environments. We are going to use Google Cloud Platfrorm, so as a runner you should pass DataflowRunner::class.java classname.
Here, we are using GCP’s Bucket as a temp and staging location, so you need to have your own bucket created before you run the project. When the pipeline object is defined, we can add steps of our transformation:
If you want to transfer the data to a BigQuery table, you need to create a TableReference object which contains information about your destination table.
Defining Pipeline Steps
Read All The CSV Files From The GCP Bucket
TextIO.read().from() is able to find and read all the files that match the passed pattern. In this case, we are looking for all CSV files in a specific GCP Bucket. As the result we get a PCollection which contains single lines from each file.
Filter Headers
PCollection from the previous pipeline step contains headers and lines of each CSV file, so we want to filter those header lines. We are using Filter.by function on PCollection which filters header line. As the result we will get a PCollection with CSV lines.
Split Lines
Next, we want to split each CSV line with a comma separator. We are using MapElements transformation. MapElements requires you to define the returned object type and lambda transformation. We have to use TypeDescriptors in into() step to define the returned type by the lambda passed in via() step.
Map Splitted Line To Entity
After we managed to split the CSV line, we need to map the result into an object that represents a single measurement. If you want to map PCollection elements into your own defined type, you should use the TypeDescriptor.of(className) function.
Map Records To BigQuery Table Row
Before we are able to save data in a BigQuery table, we have to map the Record to a TableRow object, which can be loaded by BigQuery in the last step.
Write To BigQuery
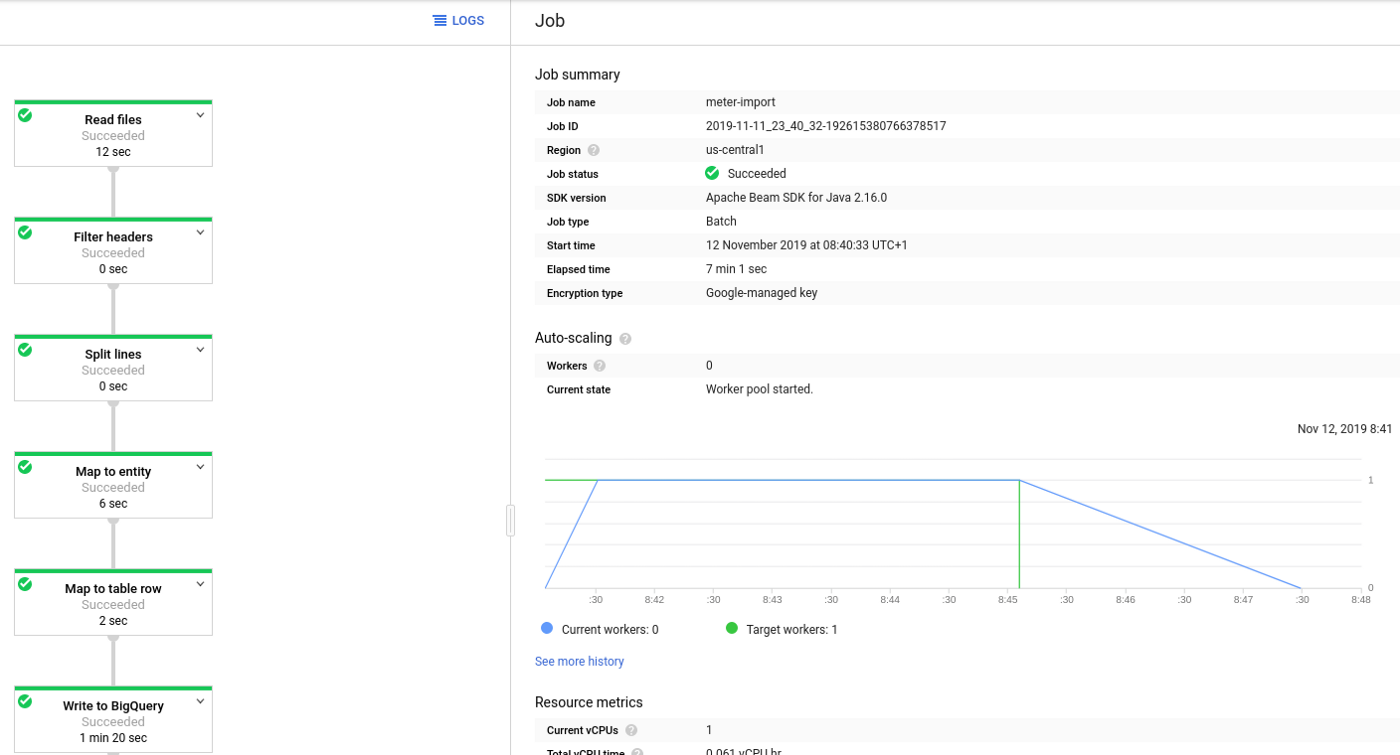
As the very last step we need to create a write disposition. When you run the code, you should see the pipeline in the DataFlow Jobs View.
Clustering Data By Using K-means And BigQuery ML
Now we have the air-quality data in our BigQuery table. We can start creating the machine learning model.
When the training process is complete, you can check the results in the “Evaluation” section. As you can see, K-means divided the data into 5 categories. We can highlight the centroid 3, which shows a cold day without rain and high pollution levels and the centroid 1, which presents a rainy day with minimal pollution.

Now you can categorize your data by using BigQuery ML.
Here’s What You Get:
DataFlow allow you to create serverless and high scalable ETL pipelines. By using BigQuery we can provide cost-efficient data analysis with machine learning models at a petabytes scale.